
Adhesive Manufacturer in China - Leading Supplier of Adhesives
I am a China-based Manufacturer of Adhesive solutions, and I know what B2B buyers wants: dependable performance, steady supply, and competitive price. Our Adhesive is engineered for fast curing, strong bonding to metals, plastics, and composites, and works well in wide temperature ranges. I ship to partners worldwide, with certifications and QA processes that keeps your production line running. From daily assemblies to heavy-duty bonding, this Adhesive offers consistent viscosity, low odor, and easy application. We offer flexible packaging, technical support in China, and fast lead times to meet your project timelines. If you need custom formulation or testing data, I can provide you with samples and ISO documentation. We are a Manufacturer that values long-term relationships, not just orders. Let me help you optimize cost per joint while maintaining quality. Let's start with a sample or a chat about your application.
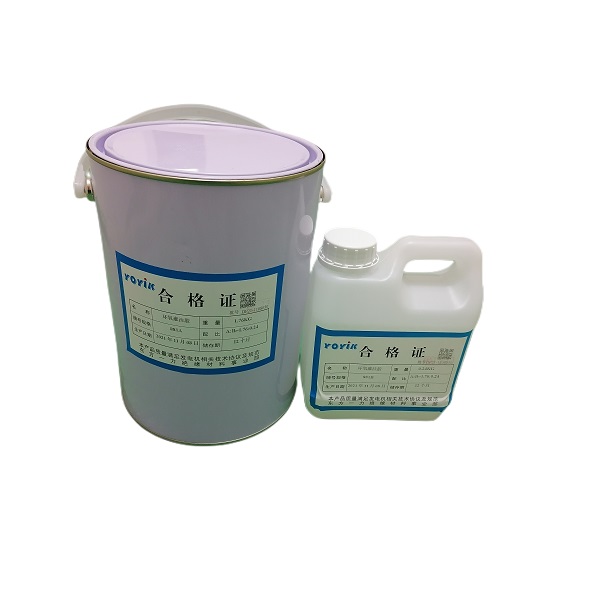


Adhesive Ahead of the Curve Outperforms the Competition
An advanced adhesive developed by a Deyang-based engineering manufacturer is redefining performance benchmarks by combining next-generation polymer chemistry with precision production. Compared with conventional products, this formulation delivers higher bond strength, faster cure under ambient and elevated temperatures, superior resistance to chemicals and humidity, and long-term dimensional stability—translating into faster assembly, lighter designs, and lower lifetime costs for OEMs and contract manufacturers worldwide. Built on scalable manufacturing and rigorous quality systems, the solution supports custom formulations, strict batch traceability, and global shipping. Backed by third-party testing and environmental compliance, it arrives in industry-standard packaging with reliable lead times and technical support to accelerate qualification cycles. For global procurement teams focused on performance, cost-efficiency, and supply security, this adhesive offers a practical path to outperform the competition.
| Sample ID | Matrix | Cure Mechanism | Viscosity mPa·s @25°C |
Lap Shear Strength MPa (ASTM D1002) mean ± SD (n=5) |
Peel Strength N / 25 mm (ASTM D3330) mean ± SD (n=5) |
Tensile Strength MPa (ASTM D638) mean ± SD (n=5) |
Elongation at break % |
Temp. Resistance Continuous °C |
Handling Time to 1 N (hours @23°C/50% RH) |
|---|---|---|---|---|---|---|---|---|---|
| Sample A | Epoxy | Room/Heat Cure | 25,000 | 22.5 ± 1.2 | 55 ± 4 | 60 ± 3 | 3.0 ± 0.5 | 120 | 6 |
| Sample B | Acrylic | Moisture / Anaerobic Compatible | 1,500 | 18.2 ± 1.0 | 65 ± 5 | 35 ± 2 | 50 ± 4 | 80 | 1 |
| Sample C | Polyurethane | Moisture Cure | 4,000 | 12.5 ± 0.9 | 75 ± 6 | 20 ± 1.5 | 250 ± 20 | 90 | 2 |
| Sample D | Silicone | RTV Condensation | 5,000 | 5.8 ± 0.7 | 110 ± 8 | 8 ± 1 | 400 ± 30 | 200 | 24 |
| Sample E | Cyanoacrylate | Anionic Polymerization | 10 | 14.0 ± 0.8 | 30 ± 3 | 20 ± 1 | 1.5 ± 0.2 | 80 | ≤0.02 |
Related Products


Adhesive Stands Out Pioneers in the Field
Top Selling Products


- Related Blog
- Reviews
